Case Statistics
Case Statistics Financial Year 25/26 (Up to September 2025)
Breakdown of Number of New Cases Received by Case Type During April 2025 to September 2025
Breakdown of Number of Active Cases by Case Type As at the end of September 2025

| No. of Cases | New Case Received | Active Case Load |
|---|---|---|
| 17/18 (Apr-Jun) | 76 | 514 |
| 17/18 (Apr-Sep) | 154 | 502 |
| 17/18 (Apr-Dec) | 216 | 500 |
| 17/18 | 286 | 509 |
| 18/19(Apr-Jun) | 77 | 536 |
| 18/19 (Apr-Sep) | 149 | 533 |
| 18/19 (Apr-Dec) | 225 | 515 |
| 18/19 | 285 | 508 |
| 19/20 (Apr-Jun) | 80 | 518 |
| 19/20 (Apr-Sep) | 182 | 550 |
| 19/20 (Apr-Dec) | 260 | 547 |
| 19/20 | 305 | 545 |
| 20/21 (Apr-Jun) | 61 | 540 |
| 20/21 (Apr-Sep) | 143 | 556 |
| 20/21 (Apr-Dec) | 211 | 557 |
| 20/21 | 288 | 569 |
| 21/22 (Apr-Jun) | 69 | 554 |
| 21/22 (Apr-Sep) | 140 | 565 |
| 21/22 (Apr-Dec) | 205 | 562 |
| 21/22 | 296 | 633 |
| 22/23 (Apr-Jun) | 78 | 645 |
| 22/23 (Apr-Sep) | 162 | 650 |
| 22/23 (Apr-Dec) | 246 | 641 |
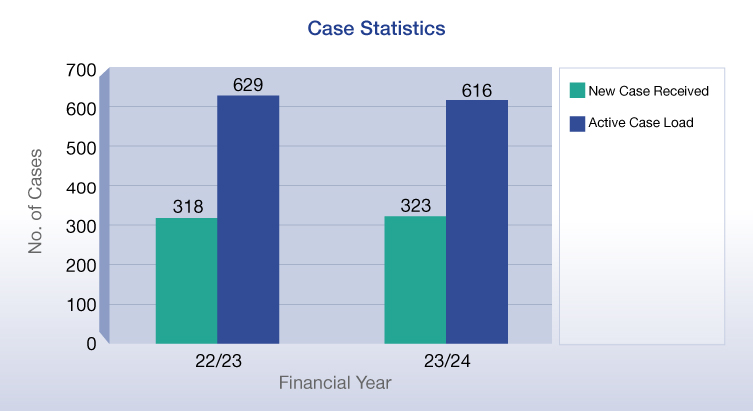
| 22/23 | 318 | 629 |
| 23/24 (Apr-Jun) | 79 | 623 |
| 23/24 (Apr-Sep) | 157 | 610 |
| 23/24 (Apr-Dec) | 232 | 608 |
| 23/24 | 323 | 616 |
| 24/25 (Apr-Jun) | 80 | 648 |
| 24/25 (Apr-Sep) | 182 | 679 |
| 24/25 (Apr-Dec) | 266 | 685 |
| 24/25 | 338 | 701 |
| 25/26 (Apr-Jun) | 97 | 730 |
| 25/26 (Apr-Sep) | 170 | 729 |